Peter Drucker, the famous management consultant, would often proclaim, “If you can’t measure it, you can’t improve it.” Fundraising is chock-full of metrics, and in this article (and the next), I will explore the two major different types of fundraising metrics — financial and non-financial. Both are something that boards and bosses should be monitoring to ensure a healthy and prosperous fundraising department.
Financial Metrics
These fundraising metrics are much more than achieving a fundraising goal — they should guide budgeting and activities. I will examine some of the more useful ones below.
Asked For Amount: This calculation predicates asking for a specific amount of money in the first place. This number is an aggregate total of all the ask amounts within a campaign. Many times when a campaign is unsuccessful, it is because this number isn’t large enough.
Received Amount: This number is simply the amount raised in a specific campaign. You can determine internally whether you differentiate between cash and pledges. (Any good campaign should see no more than two or three percent of pledges unfulfilled, so there shouldn’t be too much of a variance.)
Ask Ratio: This calculation is the Asked for Amount divided by the Received Amount. The ratio can be interpreted in many ways. For a major gift campaign, the ratio should be around 0.5, while for a direct mail campaign, the ratio is much more likely to hover around 0.1. The key learning is that to be in the proper ratio range, you need to be asking more. It also goes to the core of fundraising — if you are not asking for a gift, it is highly unlikely that you will receive one.
Other Responses
Open Gift: The gift request is out there, but the donor has yet to respond (positively or negatively). It is quite common for there to be many open gifts, especially in the Direct Mail modality and even some open gifts in the Annual/Major Gifts streams. Businesses and foundations are two types of donors that usually take a while to deliberate upon your request. Furthermore, the larger the ask, the longer the deliberation.
Refusal: It is so vital to track refusals. You should track both the number of refusals and the value of the asks. You should note the reason for the refusal. It could be that someone is having financial difficulties. It could be that they were unhappy about something within your organization. Remember, this is a refusal — they answered “no,” so they are not an Open Gift. I have seen some organizations count refusals in the Ask Ratio, while others have not. I believe that you should be counting the refusals in the ratio. Doing so reflects the work, even if the outcome is not what you are hoping for. If you count refusals in the ratio, expect that your ratio will be cut dramatically.
The Churn Categories
New Gift: This metric measures the number of donors that gave for the first time and the gift’s value. What is also important to note is the second gift. (This will be explored more next week.) How much is that gift when comparing it to the first? How much time elapsed between the first and second donation? Quite often, there is never a second gift, so you must constantly replenish your donor pipeline.
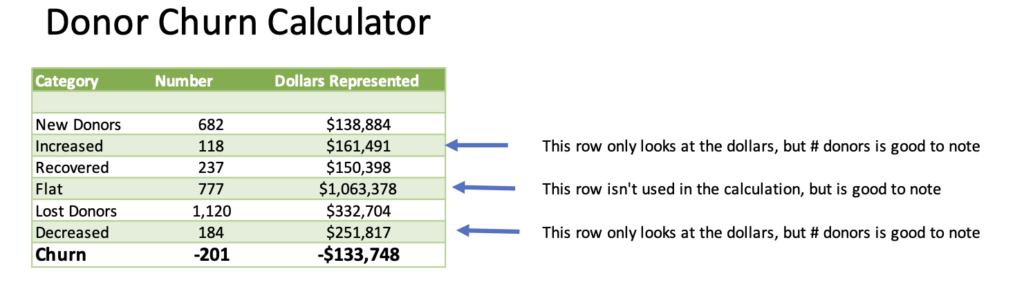
Increased Gift: This metric measures both the number of donors that increased their gift, as well as the value of their increase. This is one of the calculations that goes into the donor churn calculation.
Flat Gift: This metric measures both the number of donors that kept their gift at the same level as last year, as well as the value of these gifts. While this number isn’t directly used in the donor churn calculation, it is important to pay attention. Quite often, this number represents the largest number of donors.
Decreased Gift: This metric measures both the number of donors that lowered their gift, as well as the value of the decrease. I would suggest that you put the Refusals here as well.
Lost Gift: This is a gift that will not be canvassed in the future. Perhaps the donor passed away, or maybe the donor moved away. These Lost Gifts are unrecoverable.
Recovered Gift: This is a gift from a lapsed donor (hasn’t donated to your organization in two years) and now is back in the fold. They are technically not a new donor, as they had previously contributed to you.
The Donor Churn Calculation
Donor churn is the constant ebb and flow of donors coming into your organization and donors leaving your organization. It looks at the whole picture and can be calculated on an individual campaign or the department as a whole:
An example of a Campaign is shown below:
The Usual Stats
Average Gift: This is a reasonably straightforward calculation and is used to measure an initiative (i.e., Direct Mail piece) or the overall department. I will caution against putting too much of an emphasis on this metric if you have a small number of gifts as mega gifts can skew the numbers.
Median Gift: This calculation measures an initiative (i.e., Direct Mail piece) or the overall department. Excel can calculate it for you, but if you would like to understand the number’s significance, it is the middle value of the numbers, if you were to sort them in ascending order. Half of the sample gave more than the median, and half of the sample gave less. This calculation normalizes the mega gifts and is usually a better representation of the initiative’s success. Sometimes the median gift is pretty close to the average gift, but more often than not, there is a significant difference between the two calculations.
Inter-quartile Range: Wow, I’m using my statistics degree here! The IQR is a continuation of the Median Gift. Once you have your Median, calculate the new middle value from the lowest gift to the Median (called X) and then calculate another middle value from the Median to the highest gift (called Y). Your Inter-quartile Range is from X to Y. This means that fifty percent of people gave a gift between X and Y.
Mode Gift: This is simply the gift that is most represented. Knowing this number will surely help when establishing the ask matrix for your Direct Mail pieces. It may also help when working on a gift standards table. You can have a mode gift for each ‘phase’ of the campaign. Reverse engineering a campaign really does work. See the article I wrote about it here.
Other Revenue Streams
Bequests: This is probably one of the most formidable numbers to calculate (and estimate for budgeting purposes). I would suggest that you take a five-year rolling average for this modality. The fundraiser has little influence on when a bequest gets paid or the value of two percent of an estate.
Net Net of an Event: I have always double netted the event. There are the event’s direct costs, and then there are the indirect costs (like the staff and volunteer time). I wrote about that here. The net net of an event should never be a negative number.
All of the fundraising metrics listed above will help the fundraiser, bosses, and boards measure the correct things. Use a three-year rolling average (at least) as one data point does not make a trend. The more years you can compare, the better the tool will be at predicting the future.
Donor Retention
Retention Rate: This is a figure that you should be paying close attention to. It is a bit of an eye-opener for some:

The industry standard is somewhere between 40% and 60%. (It is a ridiculously large range, in my opinion). You should be mapping this number out over numerous years so that you can determine if this number is growing or shrinking.
Stay tuned for next week’s analysis of non-fundraising metrics — something that all shops should be examining.
L’chaim!
jack